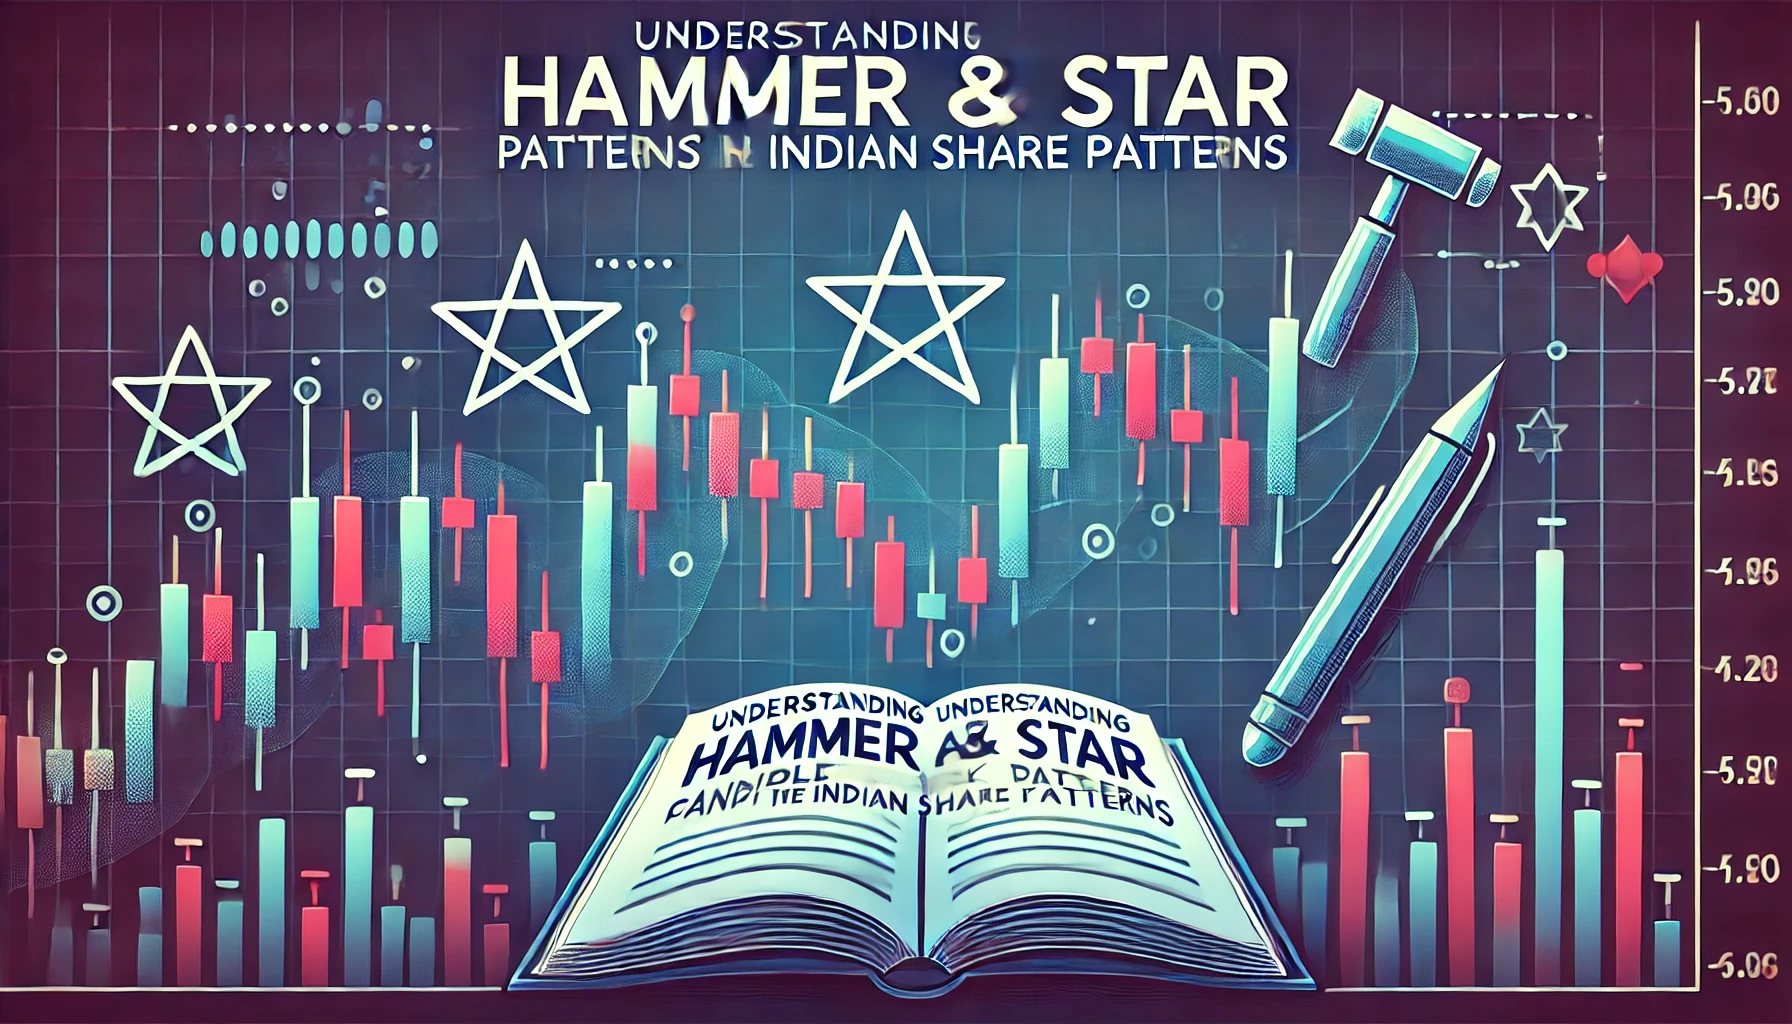
The Indian share market is known for its volatility, and understanding market patterns is crucial for making informed trading decisions. Among the various technical indicators and candlestick patterns used by traders, the Hammer and Star patterns are two of the most effective for identifying potential market reversals. These patterns can signal a shift in market sentiment, providing traders with valuable insights into possible future price movements.
In this blog, we will explore the fundamentals of Hammer and Star candlestick patterns, how they are formed, and how they can be used to improve your trading strategy. We’ll also look at historical data from the Indian stock market to illustrate the effectiveness of these patterns.
What is a Hammer Candlestick Pattern?
The Hammer candlestick pattern forms when a stock or index experiences a significant sell-off during the day but manages to recover most of its losses by the end of the trading session. It appears as a candlestick with a small body and a long lower wick (shadow), resembling a hammer. This pattern typically signals a potential bullish reversal in a downtrend, indicating that buyers have stepped in after a period of selling pressure.
Key Characteristics of the Hammer Pattern:
- Small body at the upper end of the trading range.
- Long lower wick, which is at least twice the size of the body.
- Very little or no upper wick.
- Occurs after a downtrend, signaling a potential reversal.
What is a Star Candlestick Pattern?
The Star pattern is another reversal indicator that can signal both bullish and bearish market reversals. A Star pattern occurs when a small candlestick forms after a larger candlestick, with little to no overlap between the two. The gap between the body of the two candlesticks signals a pause in market direction and is often followed by a reversal.
There are two main types of Star patterns:
- Morning Star: A bullish reversal pattern that appears after a downtrend.
- Evening Star: A bearish reversal pattern that appears after an uptrend.
Key Characteristics of the Star Pattern:
- The first candlestick has a large body, representing the current market direction.
- The second candlestick (the star) has a small body, indicating market indecision.
- A gap exists between the two candlesticks.
- The third candlestick confirms the reversal by moving in the opposite direction of the first candlestick.
Hammer and Star Patterns in the Indian Share Market
Both the Hammer and Star candlestick patterns are commonly used by traders in the Indian share market to predict potential reversals in individual stocks, indices, or even sectors like IT or banking.
Here’s an example of how the Hammer pattern appeared in Tata Consultancy Services (TCS) stock during a recent downtrend.
| Date | Open | Close | High | Low | Pattern | Signal |
|---|---|---|---|---|---|---|
| 5th July 2023 | ₹3,300 | ₹3,320 | ₹3,350 | ₹3,200 | Hammer | Bullish Reversal |
| 12th July 2023 | ₹3,340 | ₹3,360 | ₹3,400 | ₹3,310 | Star (Morning Star) | Bullish Continuation |
In this example, the Hammer pattern signaled the end of the downtrend in TCS stock, leading to a bullish reversal. A week later, the Morning Star confirmed the continuation of the upward trend.
How to Identify Hammer and Star Patterns
Hammer Pattern:
- Occurs after a downtrend.
- The lower shadow is at least twice the length of the real body.
- Little to no upper shadow.
- The body can be either green (bullish) or red (bearish), though a green body is a stronger reversal signal.
Star Pattern:
- The first candlestick has a large body in the direction of the current trend.
- The second candlestick (the star) has a small body, signaling indecision.
- A gap separates the two candlesticks.
- The third candlestick confirms the reversal.
Historical Example of Hammer and Star in Indian Stocks
Let’s analyze how the Hammer and Star patterns played out for HDFC Bank, a prominent stock in the Indian share market.
| Date | Open | Close | High | Low | Pattern | Signal |
|---|---|---|---|---|---|---|
| 15th April 2023 | ₹1,800 | ₹1,850 | ₹1,860 | ₹1,700 | Hammer | Bullish Reversal |
| 22nd April 2023 | ₹1,860 | ₹1,880 | ₹1,900 | ₹1,830 | Star (Evening Star) | Bearish Reversal |
In this scenario, the Hammer pattern at ₹1,700 marked a potential bullish reversal, followed by a recovery in HDFC Bank. The Evening Star pattern a week later signaled the beginning of a bearish reversal.
How to Use Hammer and Star Patterns in Your Trading Strategy
Hammer and Star patterns can be effectively incorporated into your trading strategy, especially when combined with other technical indicators like Moving Averages, Relative Strength Index (RSI), or Bollinger Bands.
Trading Strategies:
- Reversal Strategy: Look for Hammer and Star patterns near key support or resistance levels. These patterns can indicate potential reversals in the market direction.
- Confirmation: Use the patterns in conjunction with momentum indicators like RSI to confirm market overbought or oversold conditions. For example, if a Hammer forms while RSI shows oversold conditions, it strengthens the likelihood of a reversal.
- Entry and Exit Points: Wait for confirmation before entering a trade. For the Hammer pattern, confirmation comes when the next candlestick closes higher than the Hammer’s close. For the Star pattern, wait for the third candlestick to confirm the reversal.
Combining Hammer and Star Patterns with Other Indicators
Combining Hammer and Star patterns with indicators like RSI and Moving Averages can improve their accuracy and reliability.
| Stock | RSI | Pattern | Signal |
|---|---|---|---|
| Reliance Industries | 30 (Oversold) | Hammer | Bullish Reversal |
| Infosys | 70 (Overbought) | Evening Star | Bearish Reversal |
In this table, the combination of the Hammer pattern with an oversold RSI in Reliance Industries provided a strong buy signal, while the Evening Star in Infosys, combined with an overbought RSI, signaled a bearish reversal.
Benefits of Using Hammer and Star Patterns
- Effective Reversal Signals: Hammer and Star patterns provide clear signals for potential trend reversals, helping traders time their entries and exits more effectively.
- Works in Multiple Markets: These patterns are applicable across stocks, indices, and sectors, making them versatile for use in different trading environments.
- Easily Recognizable: Hammer and Star patterns are easy to spot on candlestick charts, making them accessible for both novice and experienced traders.
Limitations of Hammer and Star Patterns
While these patterns are highly effective, they do come with limitations:
- They are not always reliable in sideways or low-volume markets, where false signals can occur.
- Confirmation is critical, as these patterns can sometimes form without leading to a reversal.
- Hammer and Star patterns are most effective when used in combination with other indicators to confirm the strength of the reversal signal.
Historical Performance of Hammer and Star Patterns in the Indian Share Market
To better understand the effectiveness of Hammer and Star patterns, let’s look at their performance during a major market event such as the COVID-19 market crash in March 2020.
| Date | Nifty 50 Open | Nifty 50 Close | Pattern | Outcome |
|---|---|---|---|---|
| 5th March 2020 | ₹12,000 | ₹11,800 | Hammer | Bullish Reversal |
| 15th March 2020 | ₹10,500 | ₹10,200 | Evening Star | Bearish Continuation |
The Hammer pattern in early March signaled the start of a brief recovery, while the Evening Star later confirmed the continuation of the downtrend.
How to Implement Hammer and Star Patterns in Your Trading Strategy
If you’re looking to incorporate Hammer and Star patterns into your trading strategy, here’s a step-by-step guide:
- Look for Reversal Patterns: Scan for Hammer and Star patterns near key support or resistance levels to identify potential reversals.
- Wait for Confirmation: Always wait for the next candlestick to confirm the reversal before entering a trade.
- Use Technical Indicators: Combine these patterns with indicators like RSI or Moving Averages to strengthen your signals.
- Backtest Your Strategy: Use historical data to backtest your strategy and evaluate the effectiveness of these patterns before applying them in live trading.
Conclusion
Hammer and Star candlestick patterns are powerful tools for identifying potential market reversals in the Indian share market. By learning to recognize these patterns and combining them with other technical indicators, you can improve your ability to make timely and informed trading decisions. Whether you’re trading individual stocks, sectors, or indices, understanding these candlestick patterns will give you an edge in navigating the complexities of the market.

What is the TRIN stock market indicator?
The TRIN (Trading Index), also referred to as the Arms Index, is a technical analysis …
Record Sessions
The Indian share market is a dynamic and volatile space where major highs and lows …
3 Line Strike
Candlestick patterns are a vital tool for traders in the stock market, offering insights into …
3 White Soldiers and 3 Black Crows
Candlestick patterns are a key element of technical analysis in stock trading, offering clear signals …

Gapping Doji
Candlestick patterns are a critical part of technical analysis in the stock market, providing traders …
3 Windows
Candlestick patterns are a vital part of technical analysis, offering traders and investors insights into …
2 Gapping Candles
In the fast-paced world of the Indian stock market, technical analysis plays a crucial role …
3 Inside Down and Up
Candlestick patterns are powerful tools in the world of technical analysis, offering traders insight into …
Bullish and Bearish Belt Hold
Technical analysis is an essential part of trading in the Indian share market. Candlestick patterns, …

Piercing and Dark Cloud Cover
In the ever-evolving Indian stock market, candlestick patterns are crucial for traders aiming to predict …

Double Doji
Candlestick patterns have long been a favored tool for technical traders to forecast market movements. …

Rising and Falling Windows
In the world of technical analysis, candlestick patterns are vital tools for traders to anticipate …

Tweezer Top and Bottom
In the fast-paced world of the Indian share market, traders use technical analysis tools to …
Morning Star and Evening Star
In the Indian share market, technical analysis is a valuable tool for traders aiming to …

Hammer and Hanging Man
The Indian stock market offers a wealth of opportunities for traders who understand technical analysis. …

Shooting Star and Inverted Hammer
The Indian stock market, with its dynamic nature, presents various opportunities for traders and investors. …

Last Engulfing
The Indian share market is filled with patterns that can help traders make informed decisions. …

Harami
In the world of stock market analysis, candlestick patterns offer valuable insights into price movements. …

Engulfing
The Indian share market is known for its volatility, and traders often rely on technical …

Marubozu
Candlestick patterns are powerful tools used by traders in the Indian share market to analyze …

Spinning Top
The Indian share market, like any other, experiences constant fluctuations due to a multitude of …

Doji
The Indian share market is dynamic, with investors using various tools to gauge stock performance. …

Double Top
In the world of technical analysis, chart patterns are valuable tools that help traders spot …
Tweezer
In the Indian share market, where volatility and price fluctuations are part of daily trading, …

Harami
In the world of technical analysis, candlestick patterns are powerful tools that help traders make …

Heiken-Ashi
Navigating the Indian share market can be challenging due to the inherent volatility and market …

Ichimoku
In the world of technical analysis, few indicators offer the comprehensive insights that the Ichimoku …

Value Charts
In the ever-changing landscape of the Indian share market, traders and investors need tools that …

Money Flow Index
In the Indian share market, identifying trends, understanding momentum, and assessing volume are critical components …

Aroon
In the fast-paced world of the Indian share market, identifying market trends and spotting reversals …

Gator Indicator
In the Indian share market, success is largely dependent on identifying the right trends and …
